Tweet
Replying to @tahnok
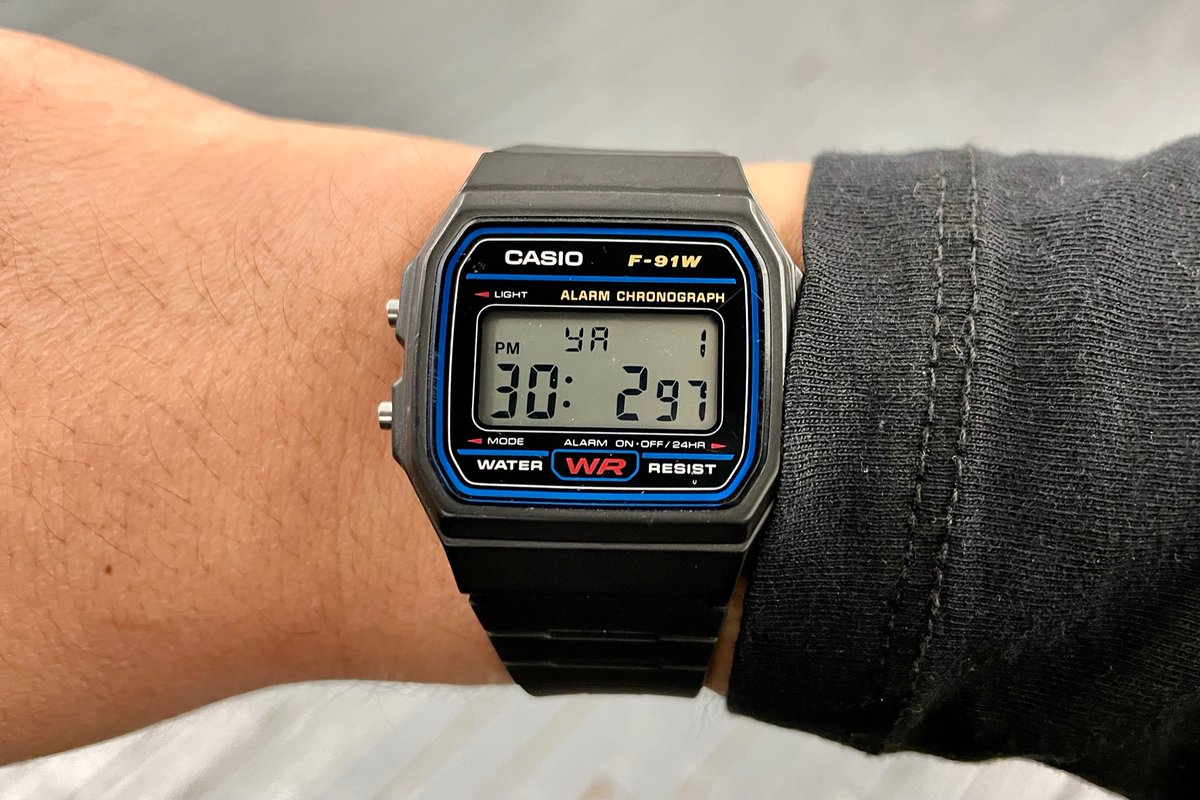
As of now, I’m displaying it on the LCD and manually typing into a spreadsheet. It’s not the most efficient way, but the UI works: alarm button moves backwards through samples, light button cycles through which axis we’re viewing; e.g. this is 297 events on the Y axis at 1:30 PM.

(original)